Visualizations
Many programs contain a significant amount of graphical data. This is especially true for games, where the space used for bitmaps is often larger than the space required for the code. When disassembling a program it can be very helpful to be able to see the contents of the data regions in graphical form.
Start a new project with the Generic 6502 profile, and from the SourceGen Tutorial directory select "Tutorial5". We'll need to load an extension script from the project directory, so go ahead and save the project, using the default name ("Tutorial5.dis65").
Normally a project will give you some sort of hint as to the data format, e.g. the graphics might be a platform-specific sprite. For non-standard formats you can glean dimensions from the drawing code. For the purposes of this tutorial we're just using a simple monochrome bitmap format, with 8 pixels per byte, and we know that our images are for a Tic-Tac-Toe game. The 'X' and the 'O' are 8x8, the game board is 40x40. The bitmaps are sprites with transparency, so pixels are either solid or transparent.
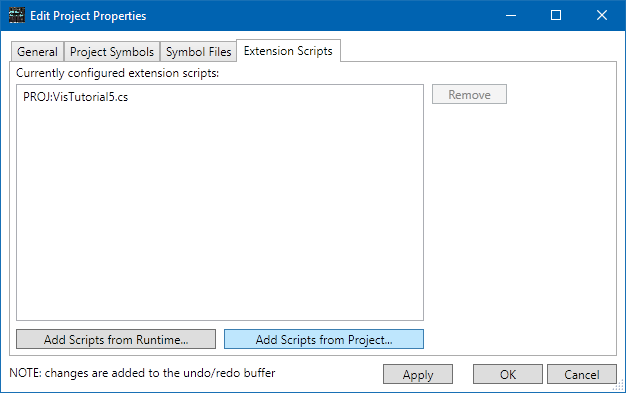
The first thing we need to do is load an extension script that can decode this format. The SourceGen "RuntimeData" directory has a few, but for this tutorial we're using a custom one. Select Edit > Project Properties, select the Extension Scripts tab, and click Add Scripts from Project. Double-click on "VisTutorial5.cs", then click OK.
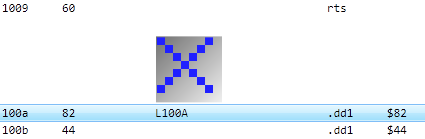
The addresses of the three bitmaps are helpfully identified by the load instructions at the top of the file. Select the line at address $100A, then Actions > Create/Edit Visualization Set. In the window that opens, click New Visualization.
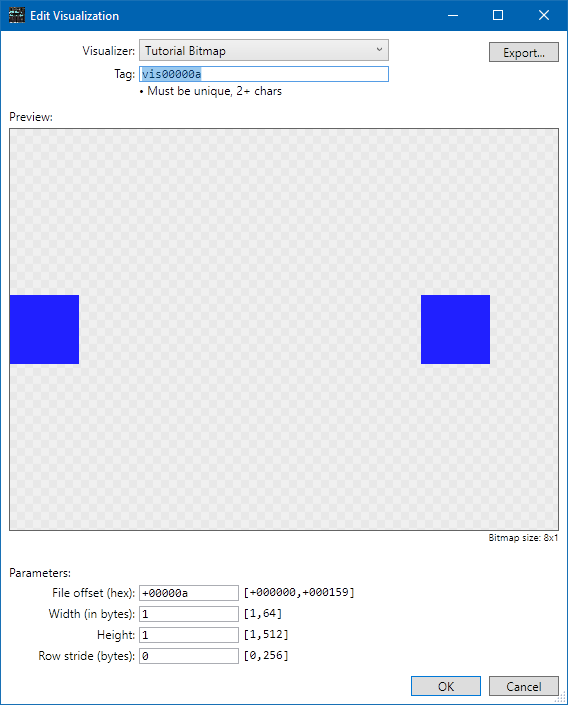
We're going to ignore most of what's going on and just focus on the list of parameters at the bottom. The file offset indicates where in the file the bitmap starts; note this is an offset, not an address (that way, if you change the address, your visualizations don't break). This is followed by the bitmap's width in bytes, and the bitmap's height. Because we have 8 pixels per byte, we're currently showing an 8x1 image. (We'll come back to look at row stride in a bit.)
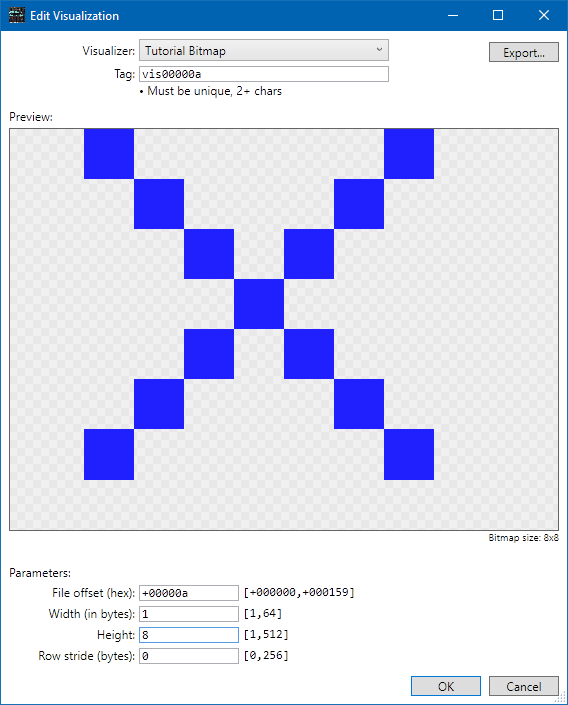
We happen to know (by playing the game and/or reading the fictitious drawing code) that the image is 8x8, so change the value in the Height field to 8. As soon as you do, the preview window shows a big blue 'X'. (The 'X' is 7x7; the last row/column of pixels are transparent so adjacent images are visually separated in the game.)
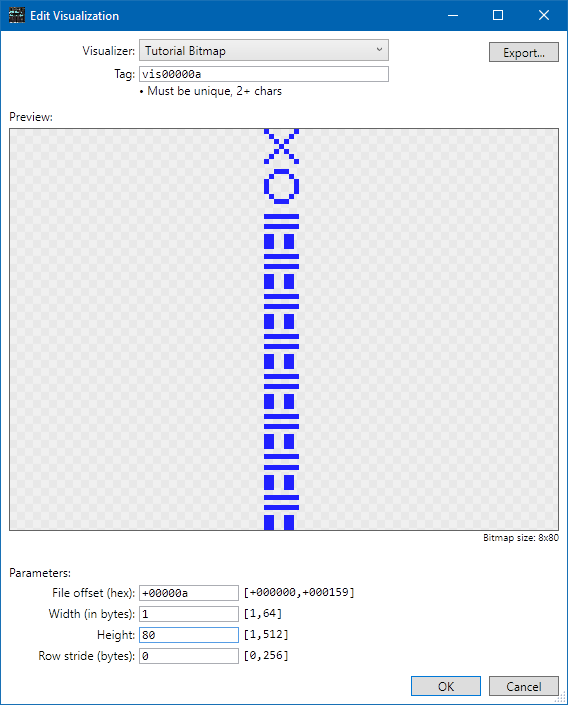
Let's try doing it wrong. Add a '0' in the Height field to make the height 80. You can see some additional bitmap data.
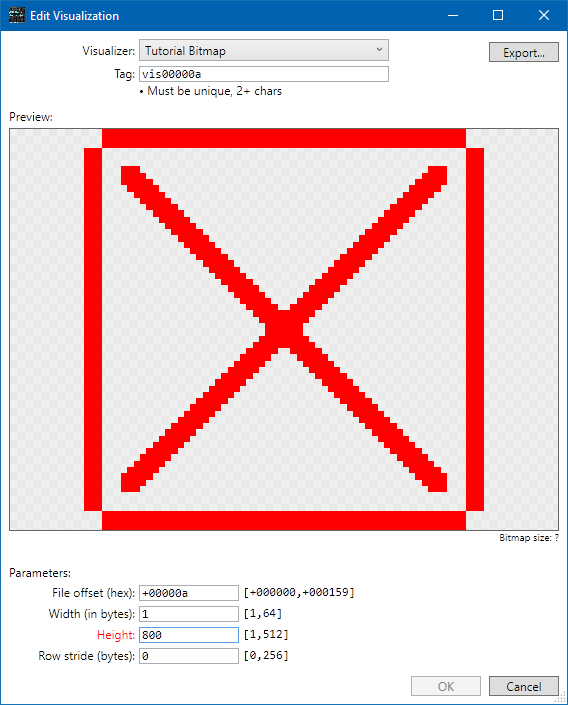
Add another 0 to make it 800. Now you get a big red X, and the Height parameter is shown in red. That's because the maximum value for the height is 512, as shown by "[1,512]" on the right.
Change it back to 8, and hit OK. Hit OK in the Edit Visualization Set window as well. You should now see the blue 'X' in the code listing above line $100A.
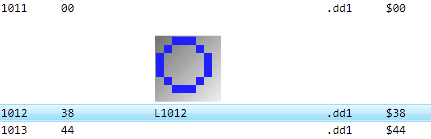
Repeat the process at line $1012: select the line, create a visualization set, create a new visualization. The height will default to 8 because that's what you used last time, so you shouldn't have to make any changes to the initial values. Click OK in both dialogs to accept the change.
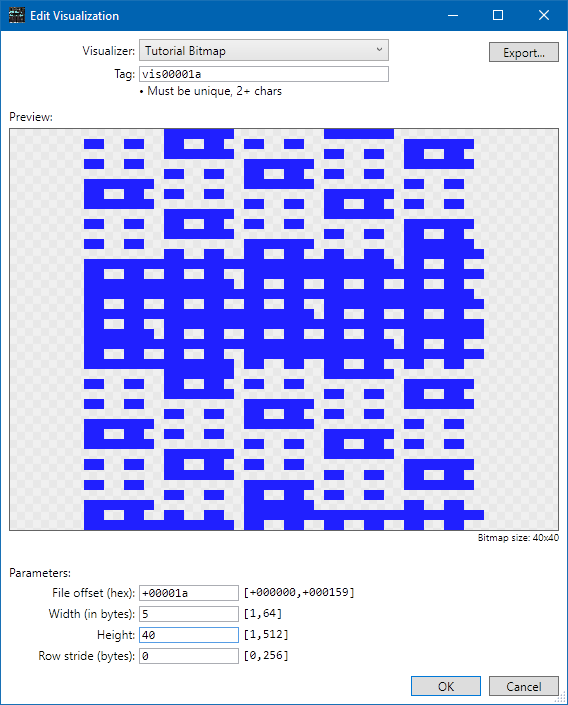
Repeat the process at line $101A, but this time the image is 40x40 pixels rather than 8x8. Set the width to 5, and the height to 40. This makes a mess.
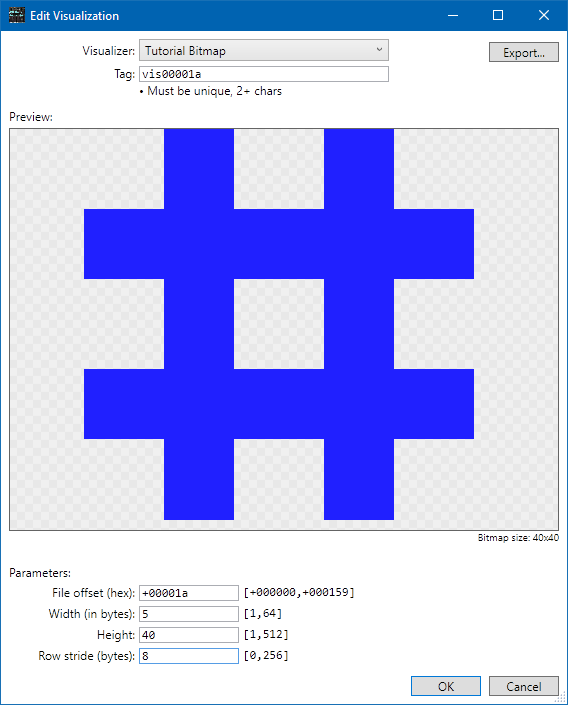
In this case, the bitmap data is 5 bytes wide, but the data is stored as 8 bytes per row. This is known as the "stride" or "pitch" of the row. To tell the visualizer to skip the last 3 bytes on each row, set the Row stride (bytes) field to 8. Now we have a proper Tic-Tac-Toe grid. Note that it fills the preview window just as the 'X' and 'O' did, even though it's 5x as large. The preview display scales everything to fit the current window size (try resizing it). Hit OK twice to create the visualization.
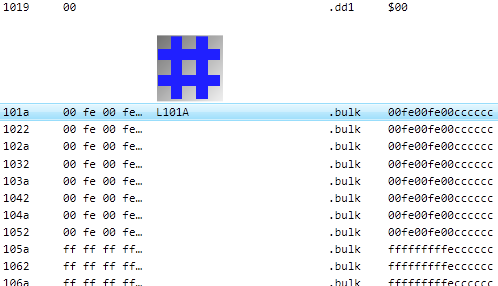
Let's format the bitmap data. Select line $101A, then shift-click the last line in the file ($1159). Actions > Edit Operand. Select Densely-packed bytes, and click OK. This is perhaps a little too dense. Open the operand editor again, but this time select the densely-packed bytes sub-option ...with a limit, and set the limit to 8 bytes per line. Instead of one very dense statement spread across a few lines, you get one line of source code per row of bitmap.
To change whether or not commas appear between bytes in the operand, open Edit > Settings, select the Display Format tab, and check Use comma-separated format for bulk data. This trades off compactness for ease of reading.
Bitmap Animations
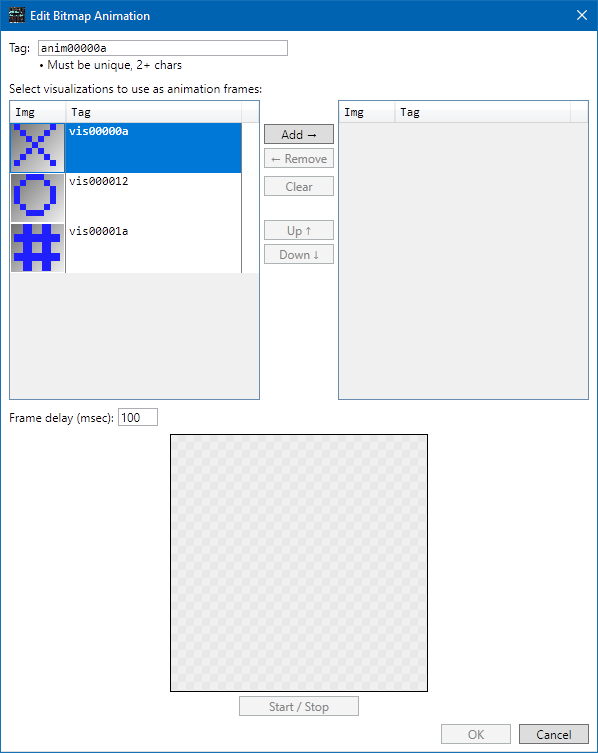
Some bitmaps represent individual frames in an animated sequence. You can convert those as well. Double-click on the blue 'X' to open the visualization set editor, then click "New Bitmap Animation". This opens the Bitmap Animation Editor.
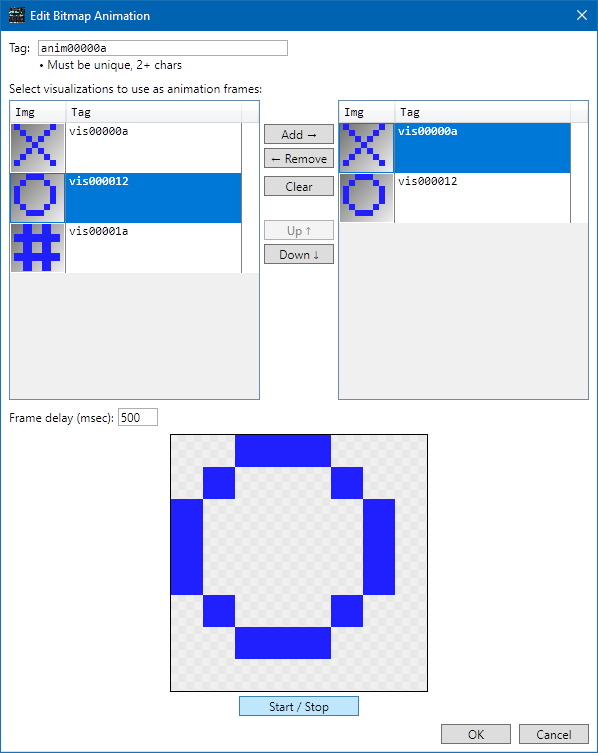
Let's try it with our Tic-Tac-Toe board pieces. From the list on the left, select the blue 'X' and click Add, then click the 'O' and click Add. Below the list, set the frame delay to 500 msec. Near the bottom, click Start / Stop. This causes the animation to play in a loop.
You can use the controls to add and remove items, change their order, and change the animation speed. You can add the grid bitmap to the animation set, but the preview scales the bitmaps up to full size, so it may not look the way you expect.
Hit OK to save the animation, then OK to update the visualization set.
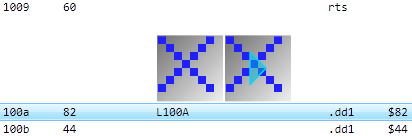
The code list now shows two entries in the line: the first is the 'X' bitmap, the second is the animation, which is shown as the initial frame with a blue triangle superimposed. (If you go back into the editor and reverse the order of the frames, the list will show the 'O' instead.) You can have as many bitmaps and animations on a line as you want.
If you have a lot of bitmaps it can be helpful to give them meaningful names, so that they're easy to identify and sort together in the list. The Tag field at the top of the editor windows lets you give things names. Tags must be unique.
Other Notes
The visualization editor is intended to be very dynamic, showing the results of parameter changes immediately. This can be helpful if you're not exactly sure what the size or format of a bitmap is. Just keep tweaking values until it looks right.
Visualization generators are defined by extension scripts. If you're disassembling a program with a totally custom way of storing graphics, you can write a totally custom visualizer and distribute it with the project. Because the file offset is a parameter, you're not limited to placing visualizations at the start of the graphic data -- you can put them on any code or data line.
Visualizations have no effect on assembly source code generation, but they do appear in code exported to HTML. Bitmaps are converted to GIF images, and animations become animated GIFs.
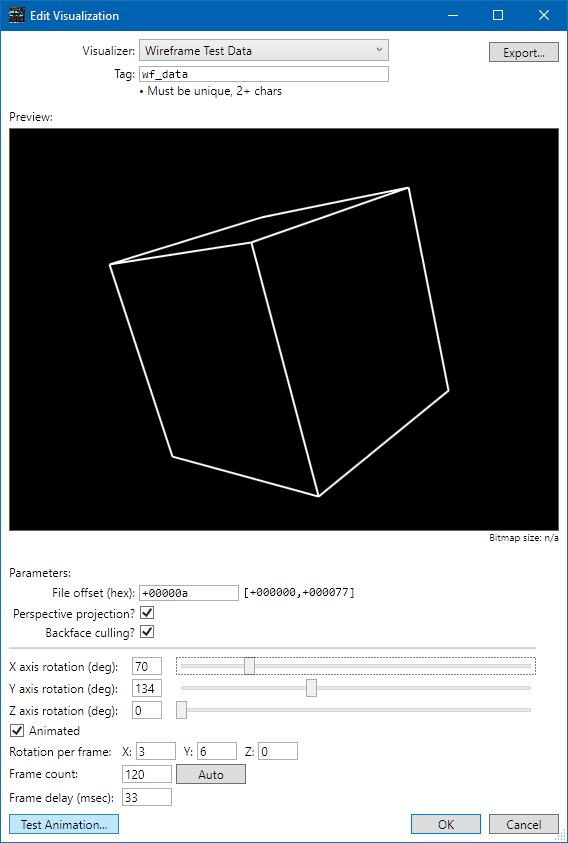
You can also create animated visualizations of wireframe objects (vector graphics, 3D shapes), but that's not covered in this tutorial.